Domain: Data Visualization
-

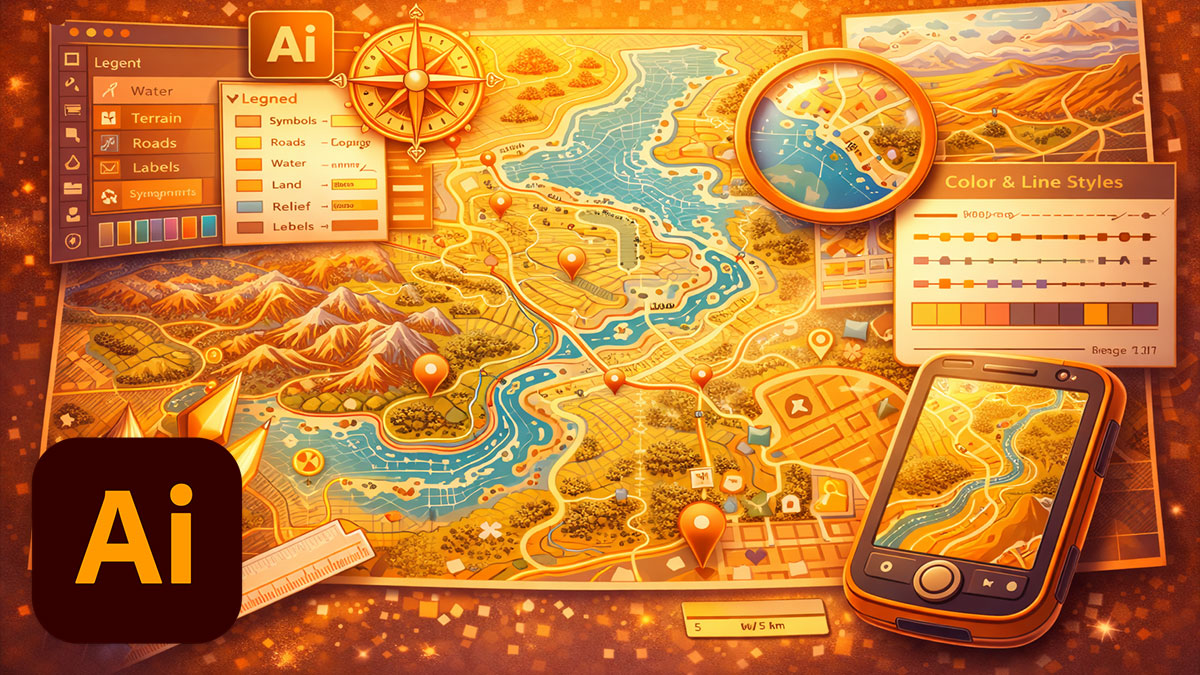
Adobe Illustrator Cartography Map Design
Overview Maps combine data, geography, and design into visuals that inform and guide. This advanced course teaches you to create professional maps in Illustrator—from importing geographic data to styling terrain, roads, and landmarks with clarity and visual appeal. Whether you’re designing transit maps, editorial illustrations, or wayfinding systems, you’ll learn techniques that cartographers and designers…
-
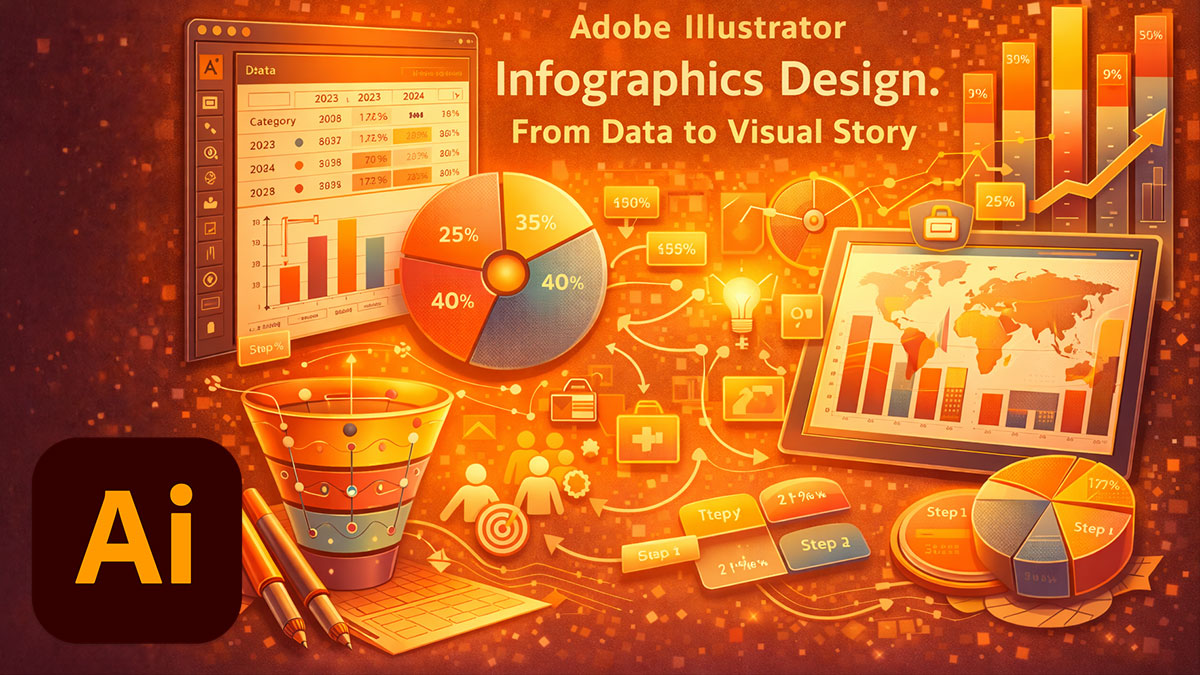
Adobe Illustrator Infographics Design: From Data to Visual Story
Overview Data visualization isn’t just about charts—it’s about making numbers clear, compelling, and memorable. This two-day course takes you from Illustrator’s built-in Graph tools through advanced custom visualization techniques, giving you the skills to transform spreadsheets into professional infographics that inform and engage. You’ll work with Excel data integration, customize chart appearances to match brand…